LineMark
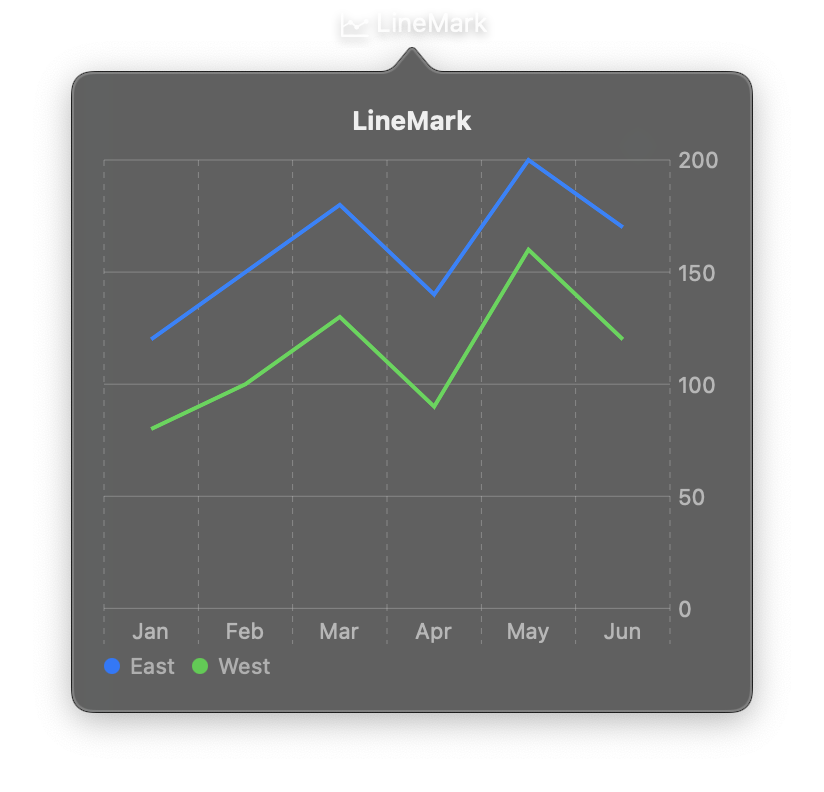
Connects data points with a continuous line, ideal for showing trends over time or continuous relationships between variables. Lines can be styled with different colors, widths, and interpolation methods. Optional symbols (markers) can be placed at each data point for individual value visibility.
LineMark is used inside a Chart container as one of the marks entries.
Constructor
nib.LineMark(
    x,
    y,
    foreground_style=None,
    symbol=None,
    interpolation=None,
    line_width=None,
    opacity=None,
)
Parameters
| Parameter | Type | Default | Description |
|---|---|---|---|
x |
str | PlottableField |
required | Data field name for the x-axis position. Can be a string or a PlottableField with explicit type information. |
y |
str | PlottableField |
required | Data field name for the y-axis position. Can be a string or a PlottableField with explicit type information. |
foreground_style |
str | PlottableField |
None |
Line color. Accepts hex strings ("#3B82F6"), named colors ("blue"), or a PlottableField to color lines by a data category (automatic palette assignment). |
symbol |
SymbolShape | str | PlottableField |
None |
Shape of data point markers. Use a SymbolShape enum (CIRCLE, SQUARE, TRIANGLE, DIAMOND, CROSS, PLUS, PENTAGON, HEXAGON), a string, or a PlottableField to vary symbols by category. |
interpolation |
InterpolationMethod | str |
None |
Curve interpolation method between points. Options: LINEAR (default), MONOTONE, CATMULL_ROM, CARDINAL, STEP_START, STEP_CENTER, STEP_END. |
line_width |
float |
None |
Width of the line in points. Uses system default when not specified. |
opacity |
float |
None |
Opacity from 0.0 (transparent) to 1.0 (opaque). |
Examples
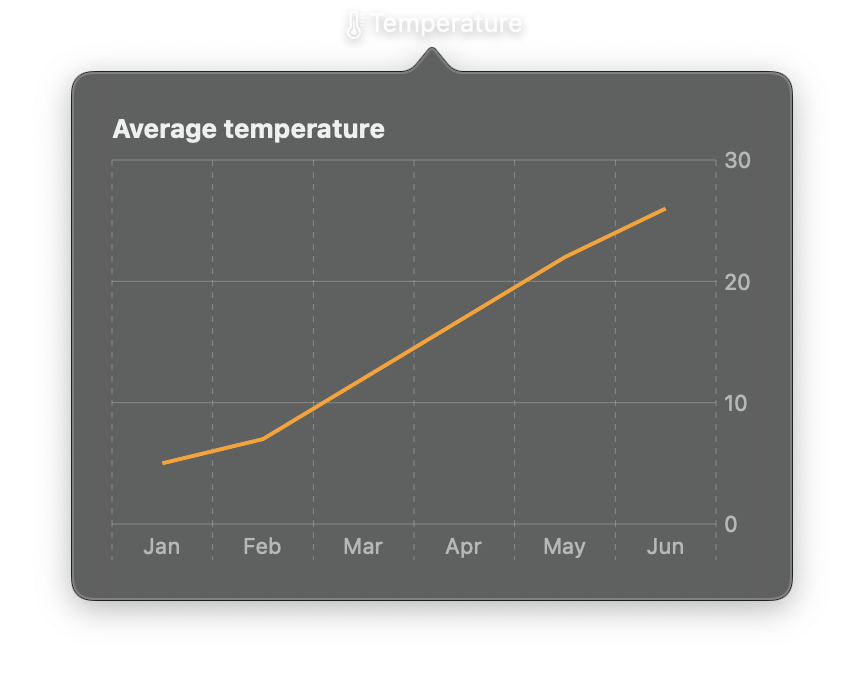
Basic line chart
import nib


def main(app: nib.App):
    app.title = "Temperature"
    app.icon = nib.SFSymbol("thermometer.medium")
    app.width = 360
    app.height = 290

    app.build(
        nib.VStack(
            controls=[
                nib.Text("Average temperature", font=nib.Font.HEADLINE),
                nib.Chart(
                    data=[
                        {"month": "Jan", "temp": 5},
                        {"month": "Feb", "temp": 7},
                        {"month": "Mar", "temp": 12},
                        {"month": "Apr", "temp": 17},
                        {"month": "May", "temp": 22},
                        {"month": "Jun", "temp": 26},
                    ],
                    marks=[
                        nib.LineMark(x="month", y="temp", foreground_style="#ff9f0a")
                    ],
                    width=320,
                    height=200,
                ),
            ],
            spacing=8,
            padding=20,
            alignment=nib.Alignment.LEADING,
        )
    )


nib.run(main)
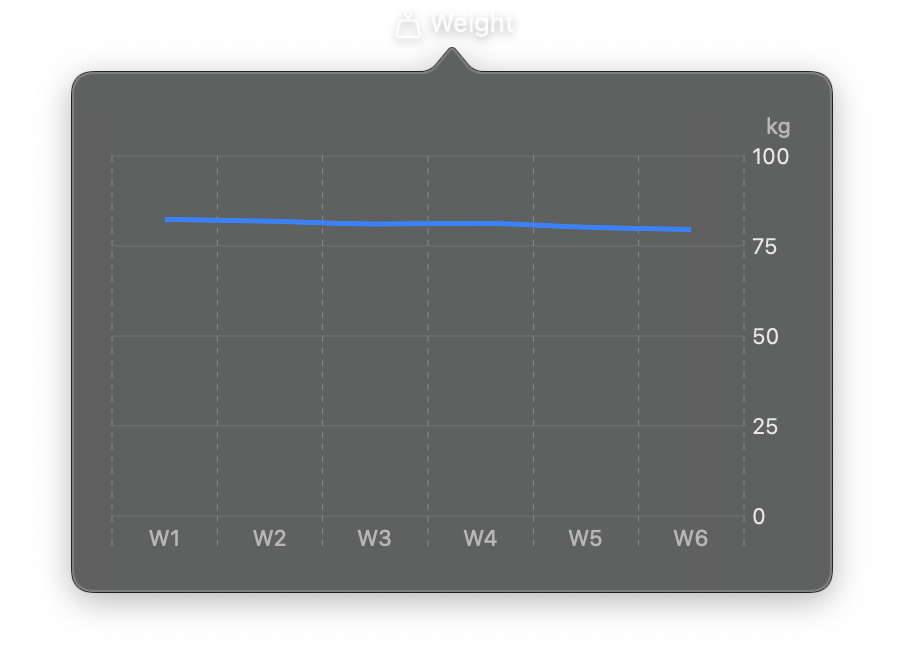
Styled line with symbols
import nib


def main(app: nib.App):
    app.title = "Weight"
    app.icon = nib.SFSymbol("scalemass")
    app.width = 380
    app.height = 260

    app.build(
        nib.Chart(
            data=[
                {"week": "W1", "kg": 82.4},
                {"week": "W2", "kg": 81.9},
                {"week": "W3", "kg": 81.1},
                {"week": "W4", "kg": 81.3},
                {"week": "W5", "kg": 80.2},
                {"week": "W6", "kg": 79.6},
            ],
            marks=[
                nib.LineMark(
                    x="week",
                    y="kg",
                    foreground_style="#0a84ff",
                    symbol=nib.SymbolShape.CIRCLE,
                    line_width=2.5,
                    interpolation=nib.InterpolationMethod.MONOTONE,
                ),
            ],
            y_axis=nib.ChartAxis(label="kg", grid_lines=True),
            width=340,
            height=220,
            padding=20,
        )
    )


nib.run(main)