AreaMark
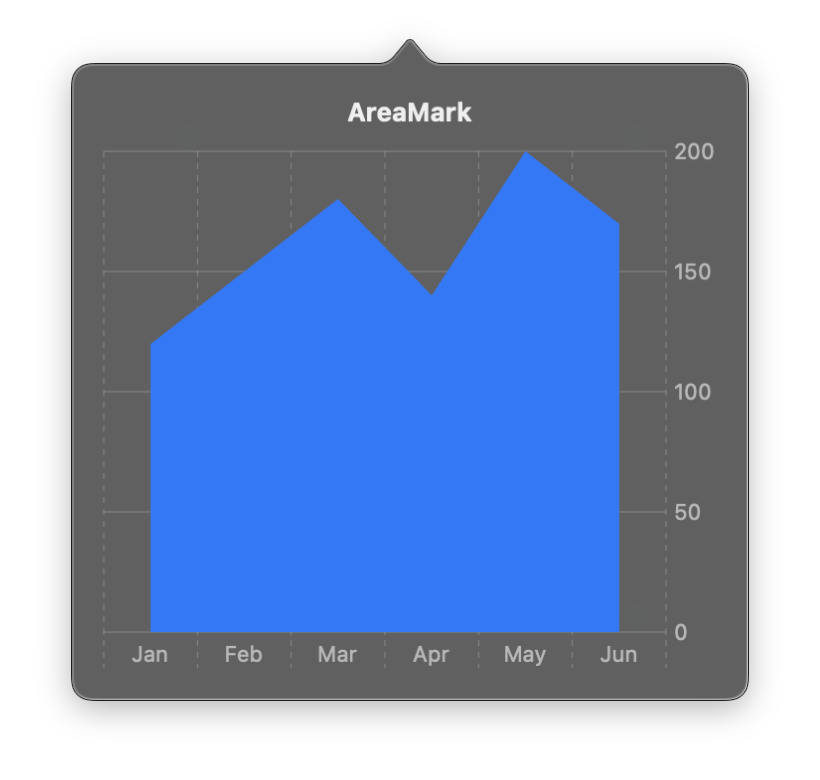
Fills the region between a line and a baseline, creating a visual representation of cumulative values or ranges. Area charts are effective for showing magnitude over time, and they support stacking for multi-series data.
By default, the area extends from zero to the y value. Use y_start to create range areas or band charts.
AreaMark is used inside a Chart container as one of the marks entries.
Constructor
nib.AreaMark(
    x,
    y,
    y_start=None,
    foreground_style=None,
    interpolation=None,
    stacking=None,
    opacity=None,
)
Parameters
| Parameter | Type | Default | Description |
|---|---|---|---|
x |
str | PlottableField |
required | Data field for the x-axis position. |
y |
str | PlottableField |
required | Data field for the upper boundary of the area (y-axis). |
y_start |
str | PlottableField |
None |
Data field for the lower boundary of the area. If omitted, the area extends from zero to the y value. Use this for range or band visualizations. |
foreground_style |
str | PlottableField |
None |
Fill color. Accepts hex strings, named colors, or a PlottableField for multi-series coloring with automatic palette assignment. |
interpolation |
InterpolationMethod | str |
None |
Curve interpolation method. Options: LINEAR, MONOTONE, CATMULL_ROM, CARDINAL, STEP_START, STEP_CENTER, STEP_END. |
stacking |
StackingMethod | str |
None |
Stacking mode for multi-series areas. Options: STANDARD (stacked), NORMALIZED (100% stacked), CENTER (stream graph). |
opacity |
float |
None |
Fill opacity from 0.0 to 1.0. Consider lower values (0.3--0.7) for overlapping areas. |
Examples
Basic area chart
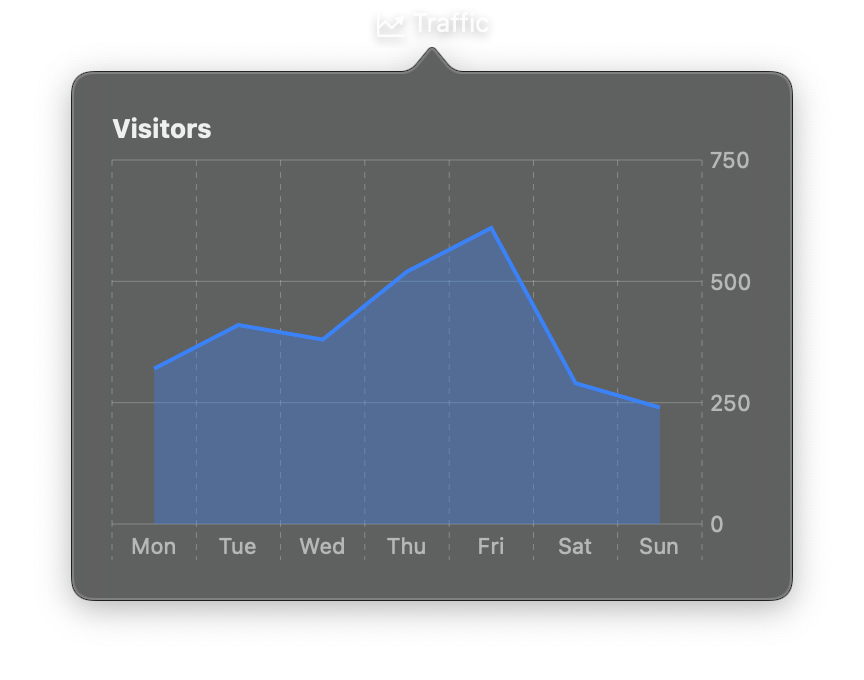
import nib


def main(app: nib.App):
    app.title = "Traffic"
    app.icon = nib.SFSymbol("chart.line.uptrend.xyaxis")
    app.width = 360
    app.height = 290

    app.build(
        nib.VStack(
            controls=[
                nib.Text("Visitors", font=nib.Font.HEADLINE),
                nib.Chart(
                    data=[
                        {"day": "Mon", "visits": 320},
                        {"day": "Tue", "visits": 410},
                        {"day": "Wed", "visits": 380},
                        {"day": "Thu", "visits": 520},
                        {"day": "Fri", "visits": 610},
                        {"day": "Sat", "visits": 290},
                        {"day": "Sun", "visits": 240},
                    ],
                    marks=[
                        nib.AreaMark(
                            x="day",
                            y="visits",
                            foreground_style="#0a84ff",
                            opacity=0.35,
                        ),
                        nib.LineMark(x="day", y="visits", foreground_style="#0a84ff"),
                    ],
                    width=320,
                    height=200,
                ),
            ],
            spacing=8,
            padding=20,
            alignment=nib.Alignment.LEADING,
        )
    )


nib.run(main)
Stacked area chart
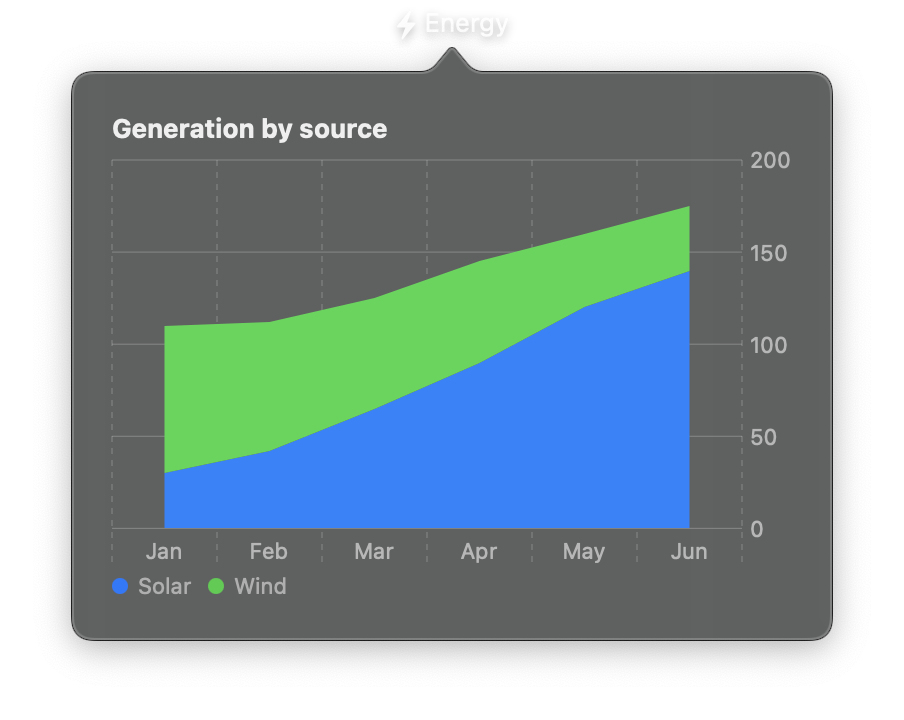
import nib


def main(app: nib.App):
    app.title = "Energy"
    app.icon = nib.SFSymbol("bolt.fill")
    app.width = 380
    app.height = 310

    months = ["Jan", "Feb", "Mar", "Apr", "May", "Jun"]
    solar = [30, 42, 65, 90, 120, 140]
    wind = [80, 70, 60, 55, 40, 35]
    data = [{"month": m, "kwh": v, "source": "Solar"} for m, v in zip(months, solar)]
    data += [{"month": m, "kwh": v, "source": "Wind"} for m, v in zip(months, wind)]

    app.build(
        nib.VStack(
            controls=[
                nib.Text("Generation by source", font=nib.Font.HEADLINE),
                nib.Chart(
                    data=data,
                    marks=[
                        nib.AreaMark(
                            x="month",
                            y="kwh",
                            foreground_style=nib.PlottableField("source"),
                            stacking=nib.StackingMethod.STANDARD,
                        ),
                    ],
                    legend=nib.ChartLegend(position="bottom"),
                    width=340,
                    height=220,
                ),
            ],
            spacing=8,
            padding=20,
            alignment=nib.Alignment.LEADING,
        )
    )


nib.run(main)