BarMark
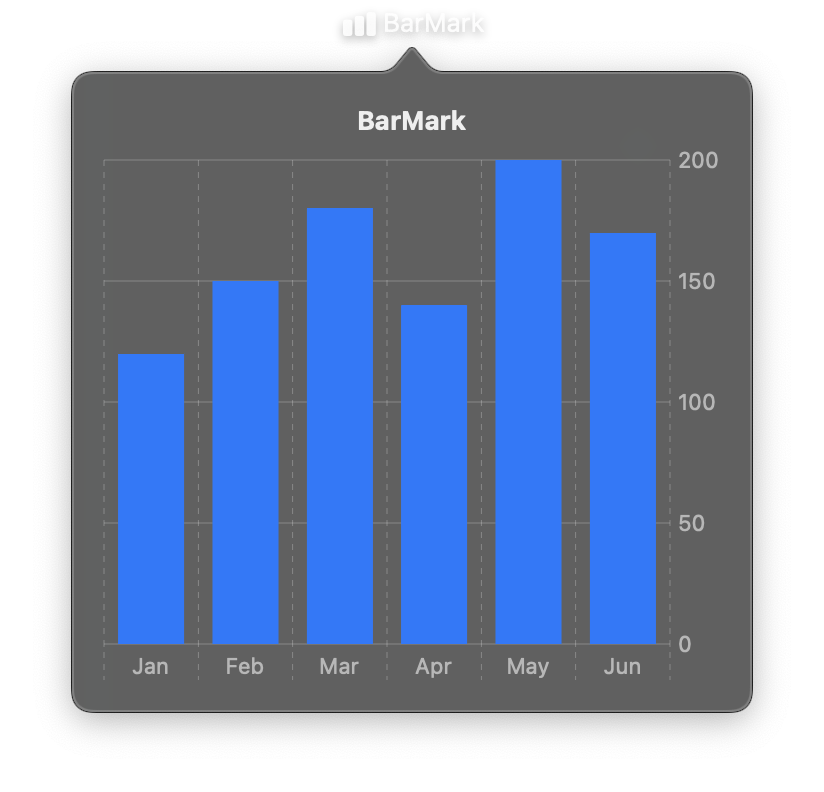
Displays data as rectangular bars, ideal for comparing discrete categories or showing distributions. Bars can be oriented vertically or horizontally and support stacking for multi-series comparisons.
The orientation is determined by which fields are categorical versus quantitative. For vertical bars, x is typically categorical and y is quantitative. Swap the fields for horizontal bars.
BarMark is used inside a Chart container as one of the marks entries.
Constructor
nib.BarMark(
    x=None,
    y=None,
    width=None,
    height=None,
    foreground_style=None,
    stacking=None,
    corner_radius=None,
    opacity=None,
)
Parameters
| Parameter | Type | Default | Description |
|---|---|---|---|
x |
str | PlottableField |
None |
Data field for the x-axis. For vertical bars, this is typically the categorical field. |
y |
str | PlottableField |
None |
Data field for the y-axis. For vertical bars, this is the quantitative field (bar height). |
width |
float |
None |
Fixed bar width in points. If not specified, bars are sized automatically. |
height |
float |
None |
Fixed bar height in points. If not specified, bars are sized by y data values. |
foreground_style |
str | PlottableField |
None |
Bar fill color. Accepts hex strings, named colors, or a PlottableField to color bars by category (creates grouped or stacked bars). |
stacking |
StackingMethod | str |
None |
How to stack bars when multiple series overlap. Options: STANDARD (stacked), NORMALIZED (100% stacked), CENTER (centered). Default is no stacking (bars are grouped side by side). |
corner_radius |
float |
None |
Radius for rounded bar corners in points. |
opacity |
float |
None |
Opacity from 0.0 to 1.0. |
Examples
Simple vertical bar chart
import nib


def main(app: nib.App):
    app.title = "Steps"
    app.icon = nib.SFSymbol("figure.walk")
    app.width = 360
    app.height = 290

    app.build(
        nib.VStack(
            controls=[
                nib.Text("Steps this week", font=nib.Font.HEADLINE),
                nib.Chart(
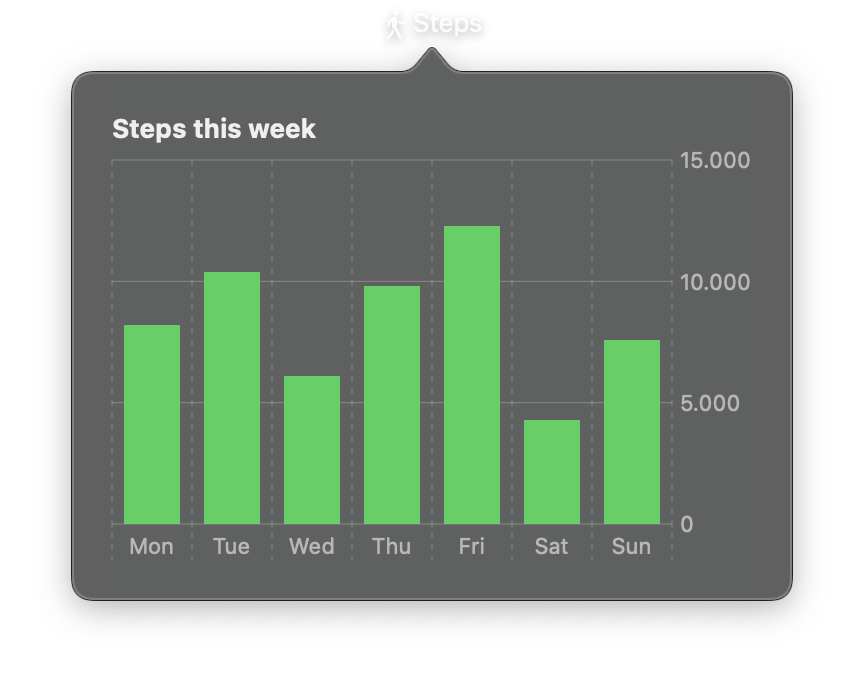
                    data=[
                        {"day": "Mon", "steps": 8200},
                        {"day": "Tue", "steps": 10400},
                        {"day": "Wed", "steps": 6100},
                        {"day": "Thu", "steps": 9800},
                        {"day": "Fri", "steps": 12300},
                        {"day": "Sat", "steps": 4300},
                        {"day": "Sun", "steps": 7600},
                    ],
                    marks=[nib.BarMark(x="day", y="steps", foreground_style="#30d158")],
                    width=320,
                    height=200,
                ),
            ],
            spacing=8,
            padding=20,
            alignment=nib.Alignment.LEADING,
        )
    )


nib.run(main)
Horizontal bar chart
import nib


def main(app: nib.App):
    app.title = "Languages"
    app.icon = nib.SFSymbol("chart.bar.xaxis")
    app.width = 380
    app.height = 290

    app.build(
        nib.VStack(
            controls=[
                nib.Text("Lines of code by language", font=nib.Font.HEADLINE),
                nib.Chart(
                    data=[
                        {"lang": "Python", "lines": 45_000},
                        {"lang": "Swift", "lines": 38_000},
                        {"lang": "Markdown", "lines": 12_000},
                        {"lang": "Shell", "lines": 2_400},
                    ],
                    marks=[
                        nib.BarMark(x="lines", y="lang", foreground_style="#ff9f0a")
                    ],
                    width=340,
                    height=200,
                ),
            ],
            spacing=8,
            padding=20,
            alignment=nib.Alignment.LEADING,
        )
    )


nib.run(main)