Chart
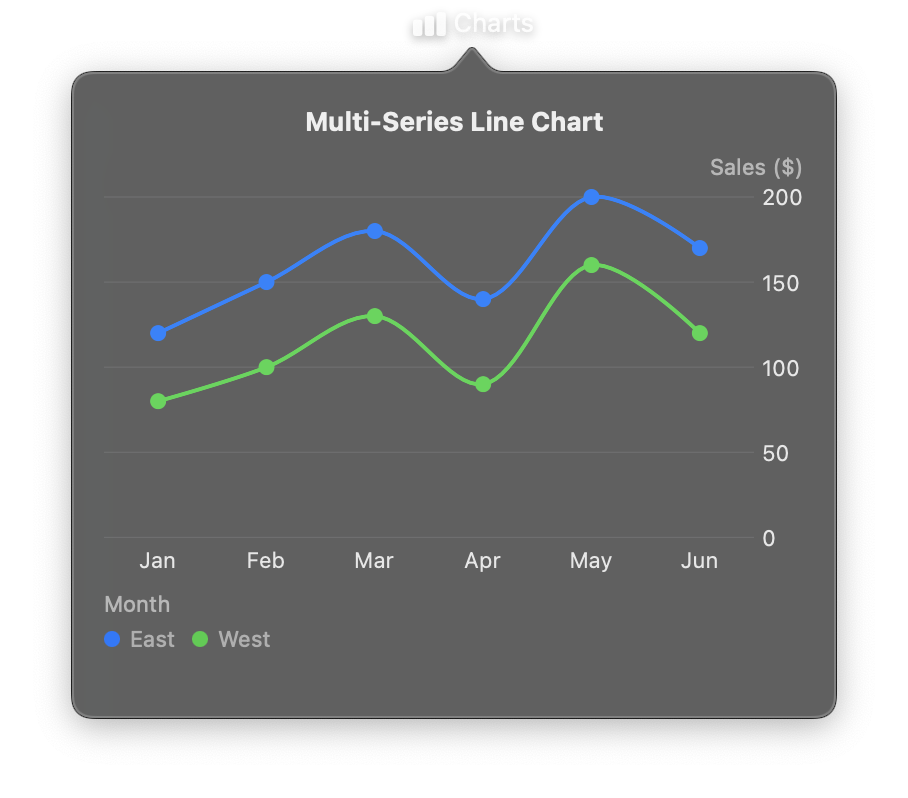
The main container for displaying data visualizations using Swift Charts. Chart manages the dataset, one or more marks, axis configuration, and legend settings. Data is provided as a list of dictionaries (row-based) and is automatically converted to an efficient columnar format for the Swift runtime.
Charts are reactive. Updating the data property or calling helper methods like append_data() triggers an automatic re-render.
Constructor
nib.Chart(
    data,
    marks,
    x_axis=None,
    y_axis=None,
    legend=None,
    chart_background=None,
    plot_background=None,
    **modifiers,
)
Parameters
| Parameter | Type | Default | Description |
|---|---|---|---|
data |
list[dict[str, Any]] |
required | Data points as a list of dictionaries. Each dictionary is a row with column names as keys. Keys must match the field names referenced in your marks. |
marks |
list[BaseMark] |
required | Chart marks that define how data is visualized. Supports LineMark, BarMark, AreaMark, PointMark, RuleMark, RectMark, and SectorMark. Multiple marks can be combined for layered visualizations. |
x_axis |
ChartAxis |
None |
Configuration for the X-axis. Controls label, grid lines, position, and formatting. |
y_axis |
ChartAxis |
None |
Configuration for the Y-axis. Controls label, grid lines, position, and formatting. |
legend |
ChartLegend | bool |
None |
Legend configuration. Pass a ChartLegend instance for custom positioning, False to hide the legend, or None for automatic behavior. |
chart_background |
str |
None |
Background color for the entire chart container including axes and legend. Accepts hex strings (e.g., "#1a1a1a") or named colors. |
plot_background |
str |
None |
Background color for the plot area only (where data is rendered). Accepts hex strings or named colors. |
**modifiers |
Common view modifiers: width, height, padding, opacity, corner_radius, border_color, border_width, shadow_radius, etc. |
Mutable Properties
| Property | Type | Description |
|---|---|---|
data |
list[dict[str, Any]] |
Get or set the chart data. Setting triggers a full re-render. |
Methods
| Method | Signature | Description |
|---|---|---|
append_data |
append_data(row: dict) |
Appends a single row and re-renders. Useful for real-time charts. |
update_data |
update_data(index: int, row: dict) |
Replaces the row at index with new values and re-renders. Silently ignored if the index is out of bounds. |
clear_data |
clear_data() |
Removes all data points and re-renders. |
Examples
Basic line chart
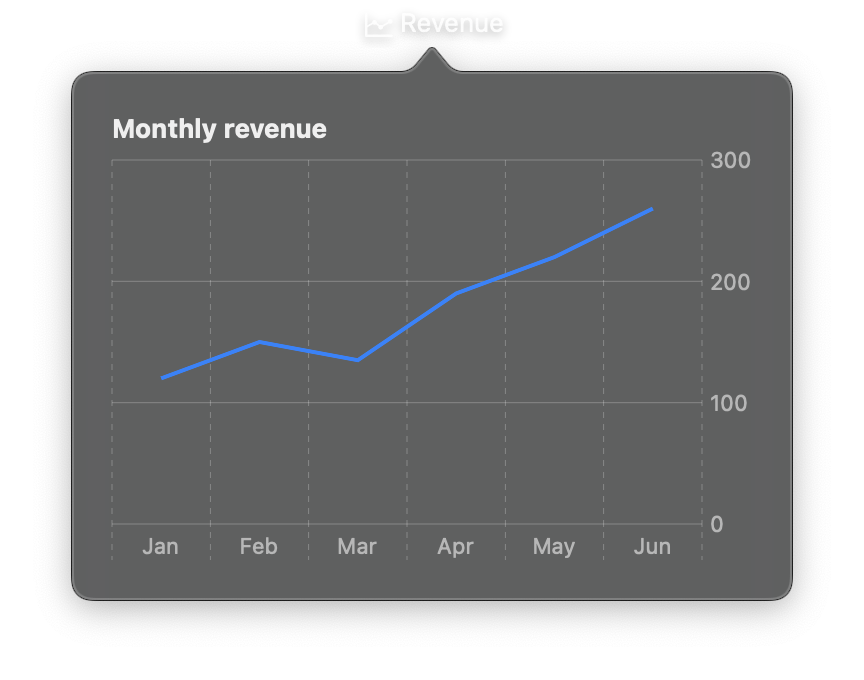
import nib


def main(app: nib.App):
    app.title = "Revenue"
    app.icon = nib.SFSymbol("chart.xyaxis.line")
    app.width = 360
    app.height = 290

    app.build(
        nib.VStack(
            controls=[
                nib.Text("Monthly revenue", font=nib.Font.HEADLINE),
                nib.Chart(
                    data=[
                        {"month": "Jan", "sales": 120},
                        {"month": "Feb", "sales": 150},
                        {"month": "Mar", "sales": 135},
                        {"month": "Apr", "sales": 190},
                        {"month": "May", "sales": 220},
                        {"month": "Jun", "sales": 260},
                    ],
                    marks=[
                        nib.LineMark(x="month", y="sales", foreground_style="#0a84ff")
                    ],
                    width=320,
                    height=200,
                ),
            ],
            spacing=8,
            padding=20,
            alignment=nib.Alignment.LEADING,
        )
    )


nib.run(main)
Chart with axes and legend
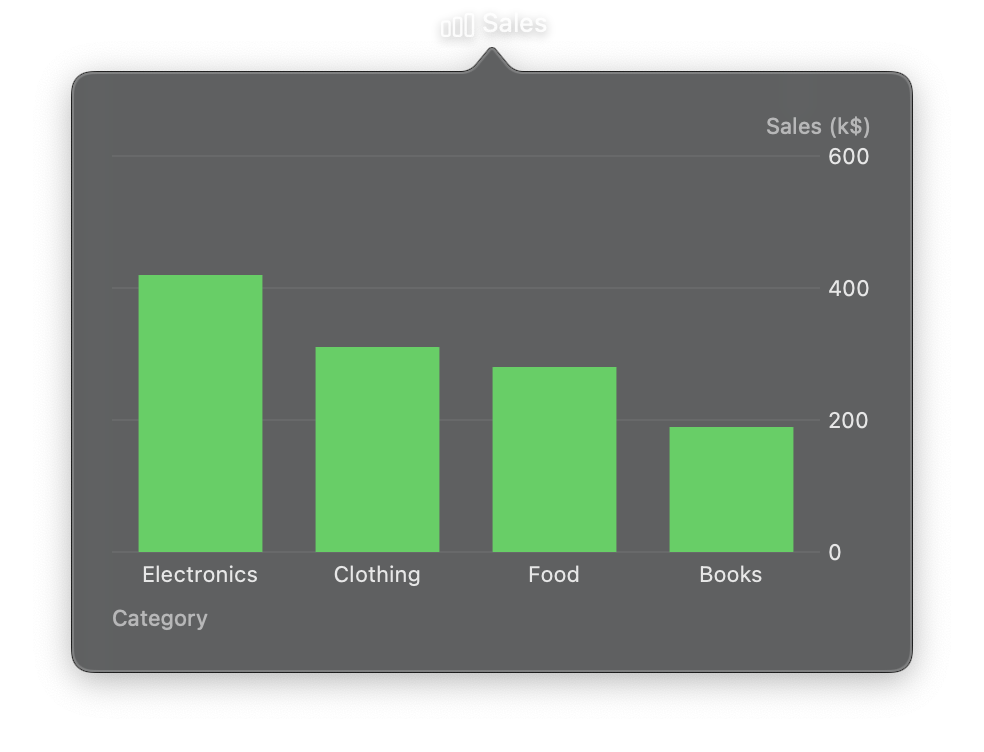
import nib


def main(app: nib.App):
    app.title = "Sales"
    app.icon = nib.SFSymbol("chart.bar")
    app.width = 420
    app.height = 300

    app.build(
        nib.Chart(
            data=[
                {"category": "Electronics", "value": 420},
                {"category": "Clothing", "value": 310},
                {"category": "Food", "value": 280},
                {"category": "Books", "value": 190},
            ],
            marks=[nib.BarMark(x="category", y="value", foreground_style="#30d158")],
            x_axis=nib.ChartAxis(label="Category"),
            y_axis=nib.ChartAxis(label="Sales (k$)", grid_lines=True),
            legend=nib.ChartLegend(position="bottom"),
            width=380,
            height=260,
            padding=20,
        )
    )


nib.run(main)